
Vast majority of Peel schools in areas with high COVID-19 infection rates located in Brampton
In households across Peel, kids are getting ready to go back to school this week, and serious questions remain unanswered. A key factor authorities and school boards have failed to outline for Peel parents and teachers is how bad the areas around their schools have been impacted by COVID-19.
Thousands of students will be converging on Peel schools to begin classes this week, and in many cases, attending neighbourhoods with persistently high case numbers for COVID-19.
On September 2, Dr. Lawrence Loh, Peel’s top public health official, said Peel Public Health had just recently shared geographic infection data with local school boards. He added it would be “premature” to detail what the data shows as he and his public health colleagues have not had a chance to discuss the repercussions with local school boards.
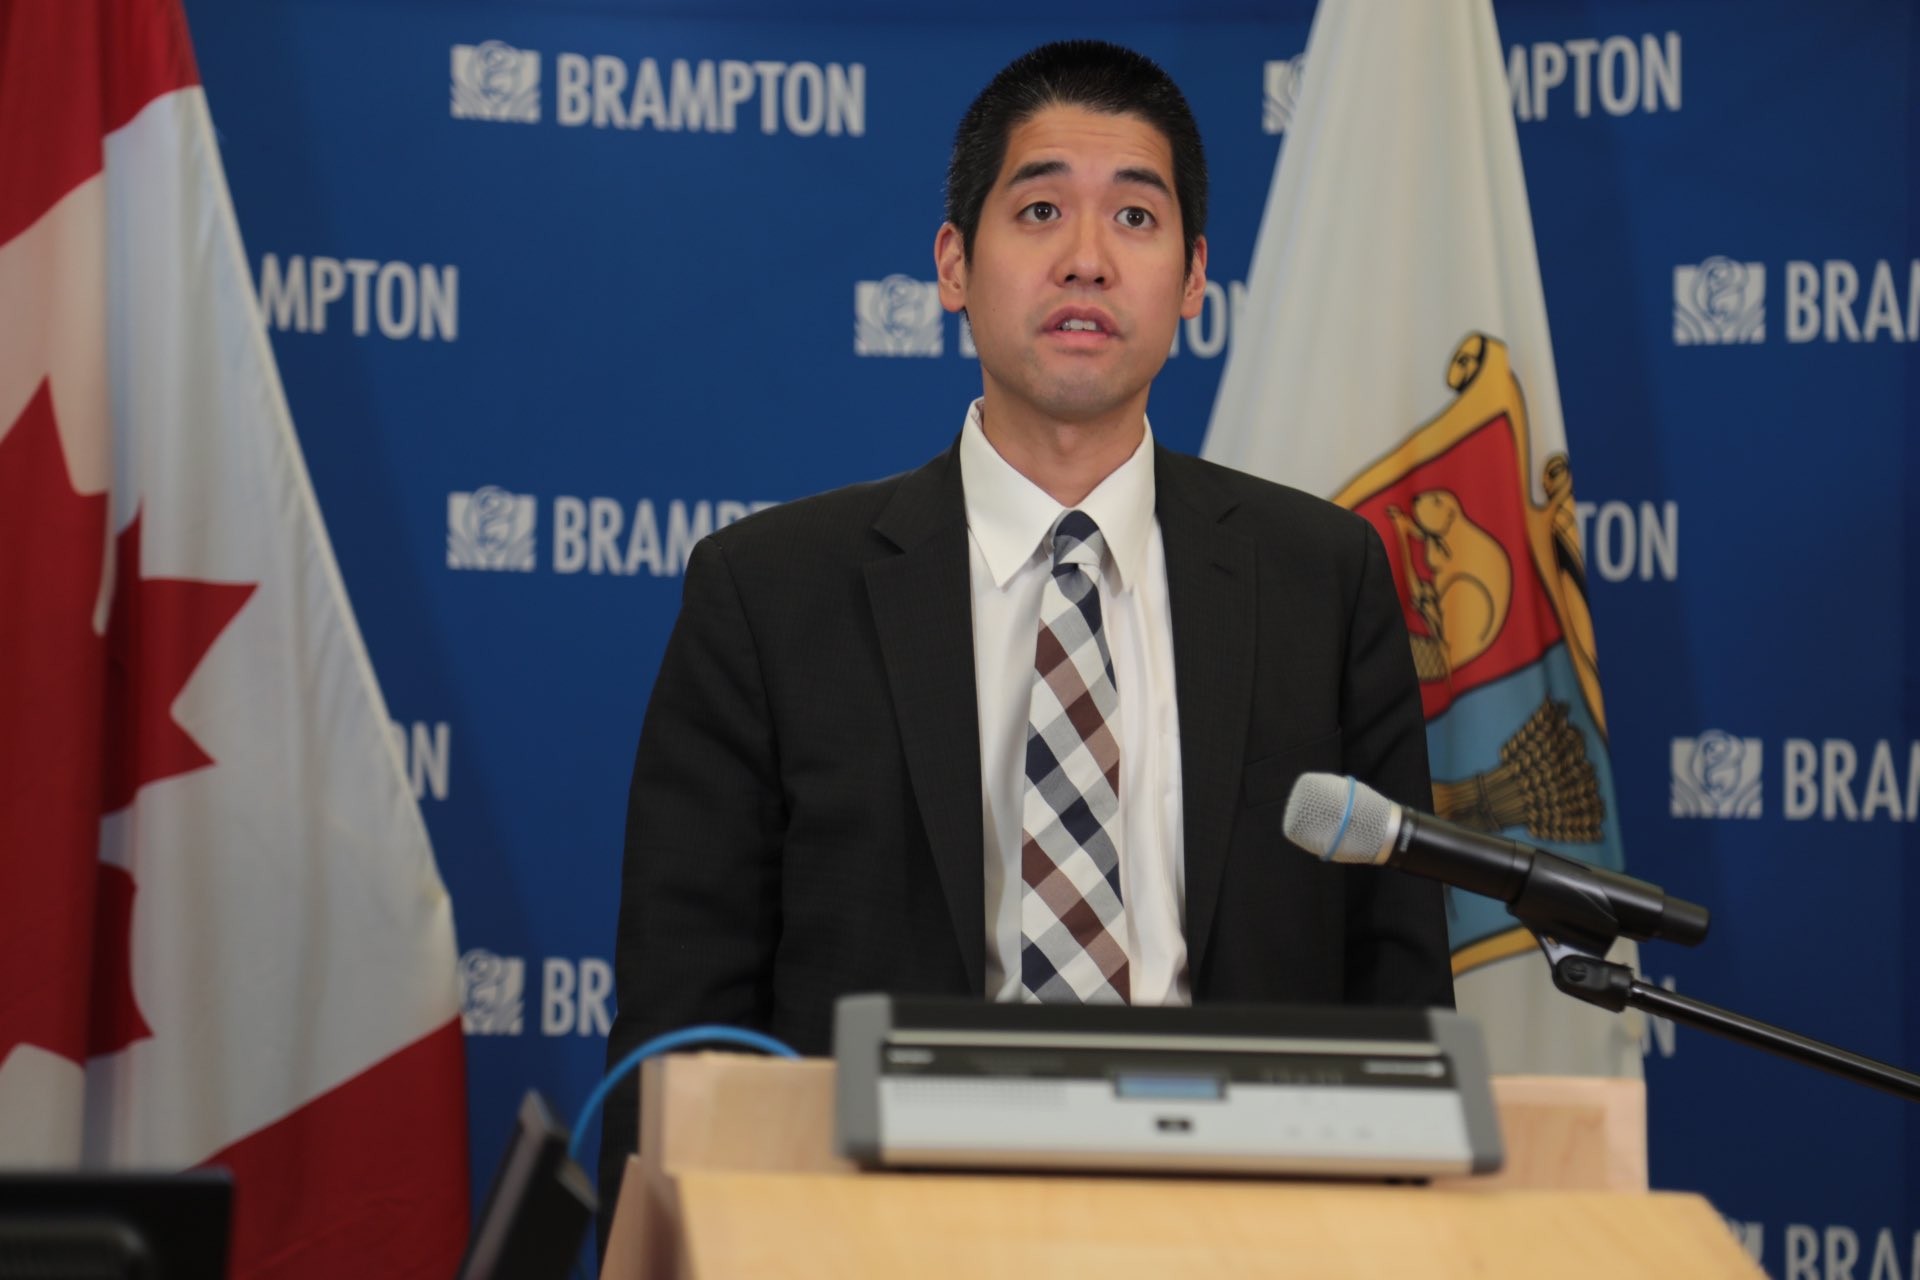
Dr. Lawrence Loh
It is unclear why the geographic data was only shared at this late stage, less than a week before students in Brampton and Mississauga began entering classrooms. Hyper-localized data would allow teachers, principals, superintendents or the PDSB supervisor appointed by the province to recommend specific measures or increased funding for high-risk schools to protect students as they return to the classroom.
In Peel, especially in Brampton, the number of COVID-19 cases per capita has far outpaced the provincial average. On Friday, Ontario Premier Doug Ford singled out the city, after a five-day period where Brampton made up almost 30 percent of the province’s total cases.
The Labour Day weekend brought more bad news for Brampton residents, after cases Saturday and Sunday represented close to the highest numbers since the beginning of the pandemic.
Despite having the medical expertise and gathering data in the local community, Peel Public Health will not be imposing any specific safety measures on particular local schools. Instead, Loh told The Pointer, he will simply advise, leaving the decisions to senior staff and administrators with no background in virology, medicine or epidemiology.
“It was made very clear to me we were to bring local public health expertise and understanding of our context, but that the reopening was ultimately being run provincially by the Ministry of Education and directed by the school boards, who have the operational mandate to open the schools,” Loh said.
Two schools, one in Brampton and one in Mississauga, already had COVID-19 cases reported among staff, prior to classes even opening.
Ross Drive Public School had a staff member in the building August 27 and since tested positive. Briarwood Public School in Mississauga has also had one case, but no details are available.
Loh added that, with the data only just shared, it would be too soon to publicly disclose any measures he may advise for particular schools impacted by the novel coronavirus.
It’s unclear why the Region’s top public health doctor is not taking a more proactive approach, designing his own protocols and providing Peel’s two publicly funded boards with directives on how viral spread should be handled, including criteria for the closure of classes and schools, along with testing requirements.
High school students attending both Dufferin-Peel Catholic District School Board and the Peel District School Board will begin the first day of orientation today (Tuesday) and elementary students (alphabetically ordered by surname) will start staggered orientation Wednesday.
Over the Labour Day Weekend, Peel District School Board added an advisory page to its website to track confirmed cases and closed classrooms at local schools. It already lists the two active cases at its two schools. According to news reports, both infected individuals were teachers. You can view the list here.
The average rates of COVID-19 per capita in the Region of Peel have been well above Ontario’s almost throughout the pandemic. At the height of the novel coronavirus’ first wave, Mississauga and Brampton were both burdened with high case counts. But as social distancing measures came into effect, the former saw its cases drop. In Brampton, high numbers, when compared to the rest of the province, have continued, putting the Region of Peel among the worst two or three areas for infection on almost any given day since the start of August.
From the start of the pandemic to September 1, Ontario had a total of 42,554 cases of COVID-19, including resolved, active and deceased. Using the province’s population from the 2016 census, this works out to an average of 316 cases per 100,000 people. By comparison, Peel’s average was 554 per 100,000 residents between February 23 and August 29.
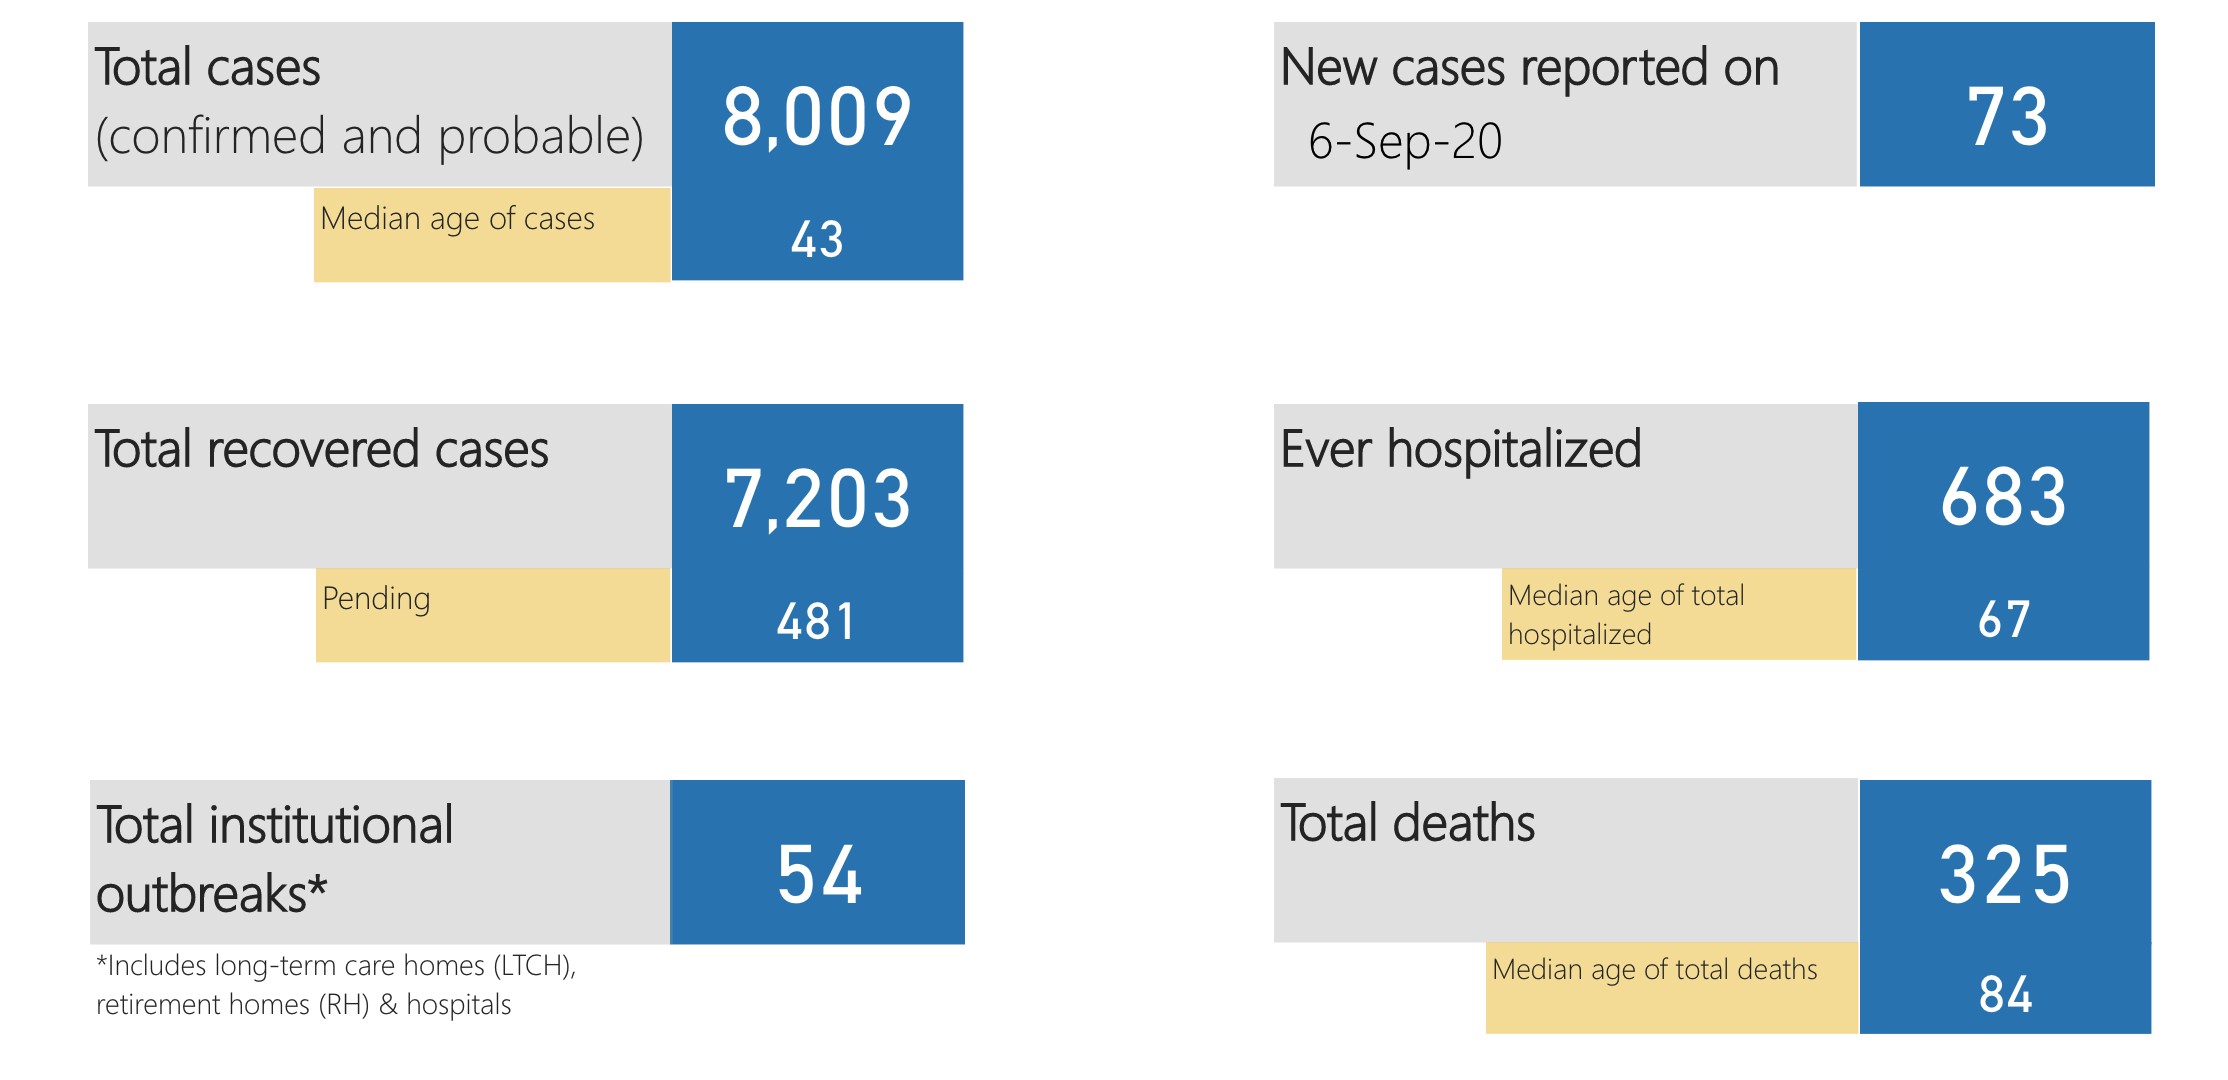
COVID-19 case numbers in Peel as of September 7.
Simply by being located within the Region of Peel, and especially Brampton, schools have a higher chance of viral spread than if they were in Northern Ontario or even Hamilton or Kitchener. The presence of the virus in the community can be exacerbated by student interaction, if the virus is introduced into a school community.
Across North America, outbreaks have been reported in schools since they reopened earlier in the summer. Quebec has already seen 46 schools with reported cases of COVID-19, since reopenings began with most of the outbreaks occurring between August 26 and September 3.
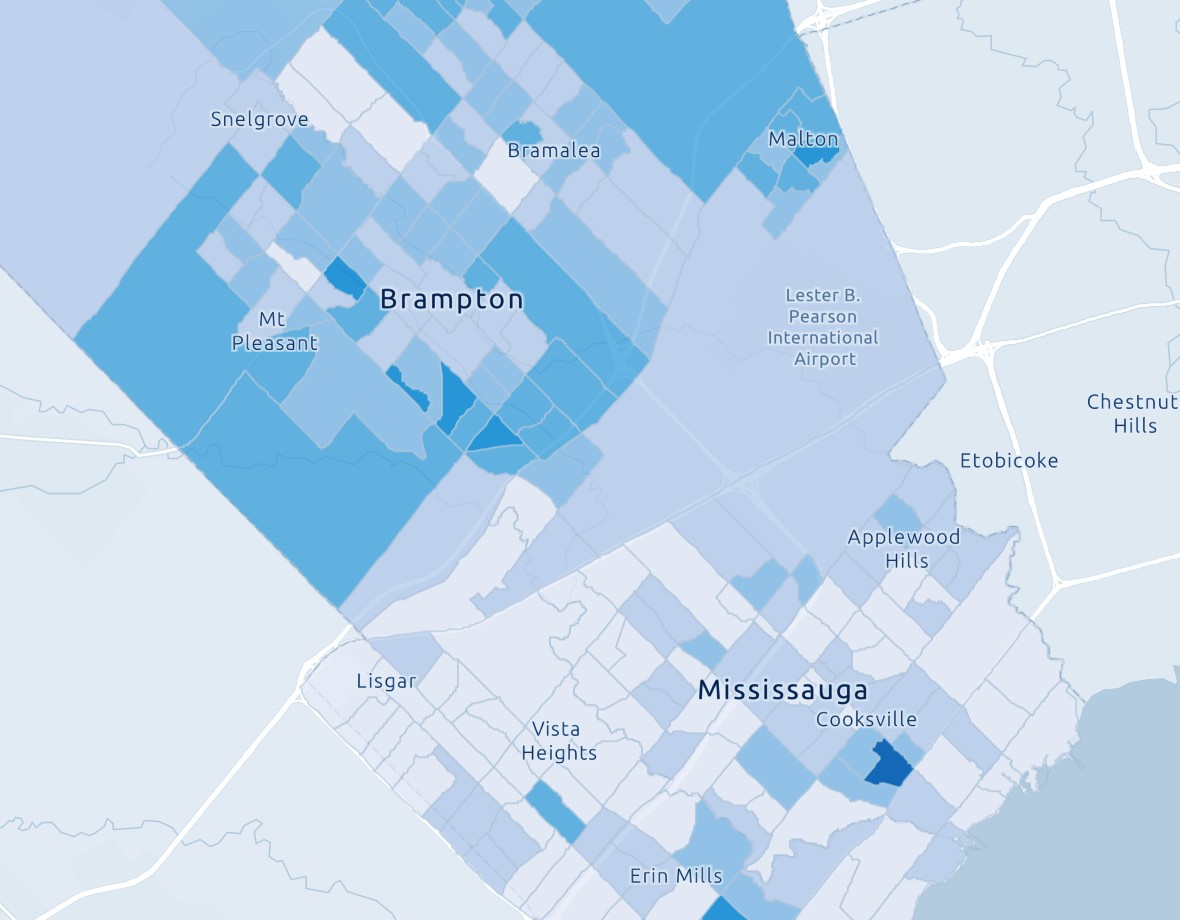
Peel Public Health recently released a geographic breakdown of COVID-19 cases by Census tract. The map tracks Brampton, Mississauga and Caledon using different shades of blue to denote the level of COVID-19 spread in that particular area of each municipality.
In order to determine which schools are located in higher-risk neighbourhoods of the region, The Pointer investigated Census tracts where the number of COVID-19 cases was equal to or greater than 732 per 100,000 residents between February 23 and August 29. The case threshold chosen focuses on areas where the risk of contracting COVID-19 is particularly high. A case rate of 732 per 100,000 residents is nearly double the average in Ontario.
In total, 33 Census tract areas in Brampton surpassed this threshold, with at least twice the provincial average of per-capita cases, while 15 in Mississauga also crossed the threshold.
In order to accurately reflect the community spread and avoid skewing the potential risk to the public, outbreaks that have occurred in long-term care settings where public interaction and community spread is greatly limited, a total of seven Census tracts were removed. Two areas in Brampton were removed because the vast majority of infections were institutional cases in congregate settings, while five in Mississauga were discounted for the same reason.
The Pointer is trying to focus on community spread and the risk of such infection in particular areas of the region.
Using the remaining areas and data obtained using Google Maps, schools were placed on a map to understand the spread of COVID-19 in the communities immediately surrounding them.
The map shows all schools in Peel located in areas where the rate of COVID-19 is above 715 cases per 100,000 residents. You can view it below.
View COVID-19 Map of Peel Schools in a full screen map
Numbers dating back to February offer a holistic picture of how the virus has spread within Peel and an assessment of potential risk. This data includes resolved and deceased cases, which do not directly impact students returning to school, but the historical figures help to highlight the potential risk in that area should a second wave of the viral spread occur following the reopening of schools.
As public health experts and politicians have repeatedly said, the novel coronavirus does not spread itself. It moves through contact. Factors such as income, density, ethnicity and where people work have all been shown to impact the rate of the virus’s spread. Areas which experienced particularly high community transmission during the first wave of the pandemic are likely to be at increased risk during any resurgence or second wave due to these and other demographic characteristics.
The Pointer will continue to monitor new data as it is published and provide future coverage of the threat from active or recent infections located in this context of historical transmission.
Each municipality has determined its own local response to the pandemic, under provincial guidelines.
During April, the height of the first wave, Mississauga struggled with a high number of cases. On April 18, for example, it reported 137 new cases, the largest single day increase in either Brampton or Mississauga. The next day, 71 cases were recorded and 27 the following day. Brampton, by comparison, had 52 cases on April 18, 83 the next day and 49 the day after that.
Fast forward to the summer and Brampton continues to be burdened by high cases, while Mississauga has seen a dramatic decrease, usually only with single-figure daily case counts, however the region’s largest city has also seen numbers tick up over the past two weeks, following entry into Stage 3 at the end of July.
Patience is part of the reason for Mississauga’s success in controlling the virus. During the beginning of both Stage 2 and Stage 3, Mayor Bonnie Crombie highlighted she was not in a rush to proceed. First, the City held back on the opening of some sports fields, then, in Stage 3, delayed the public reopening of recreation centres, even though it was allowed to open them.
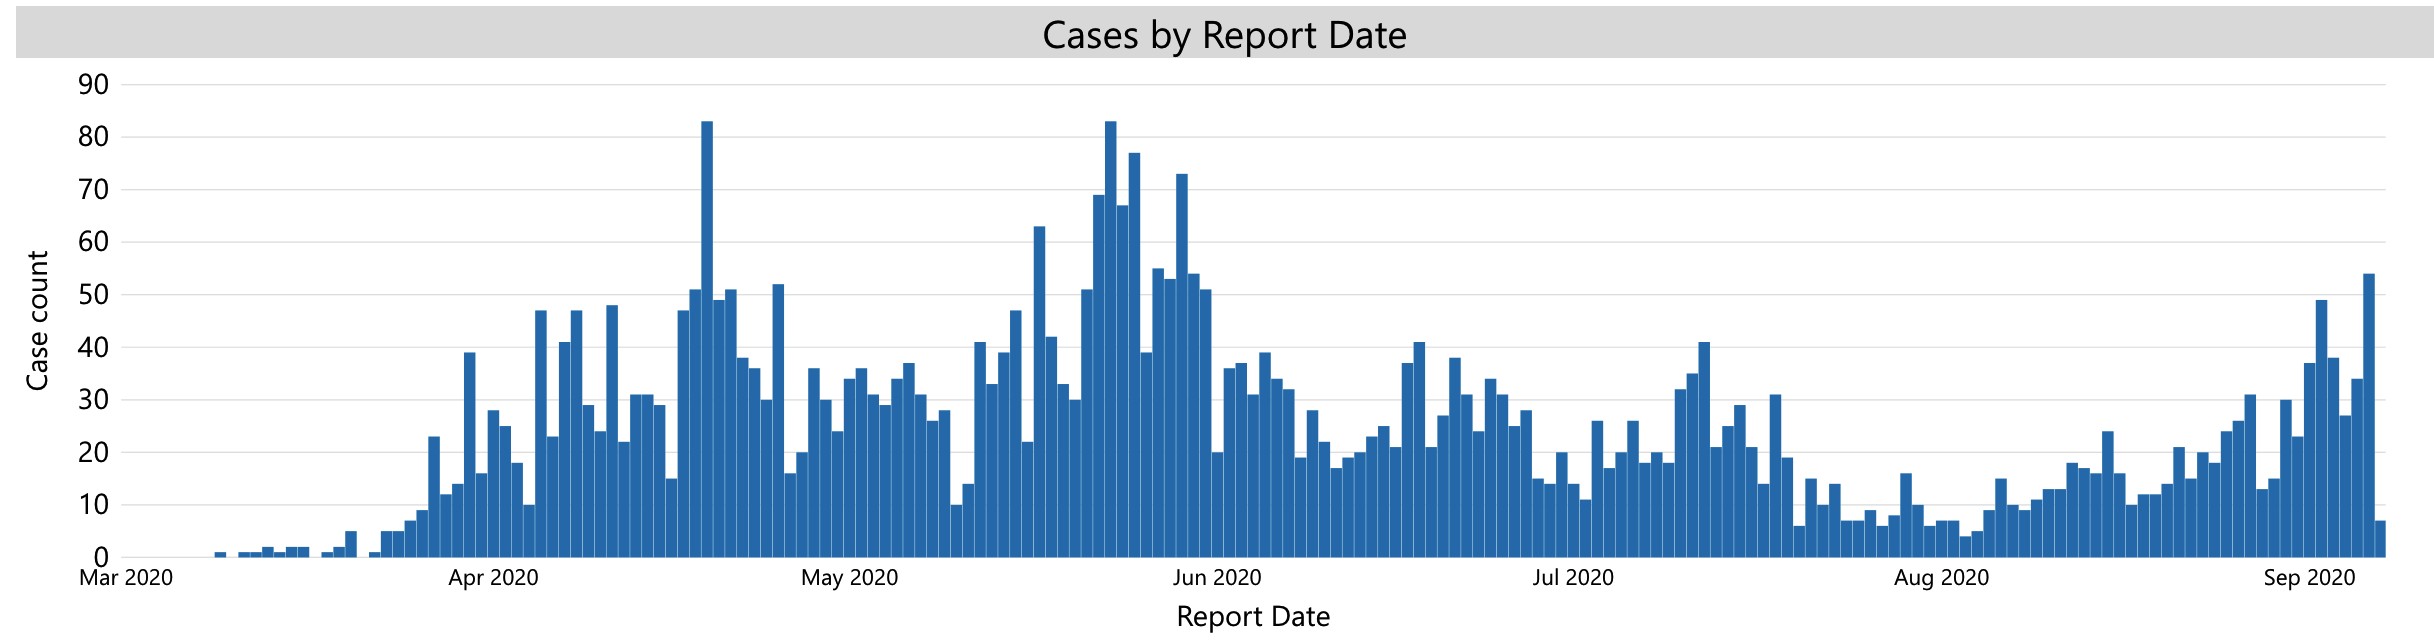
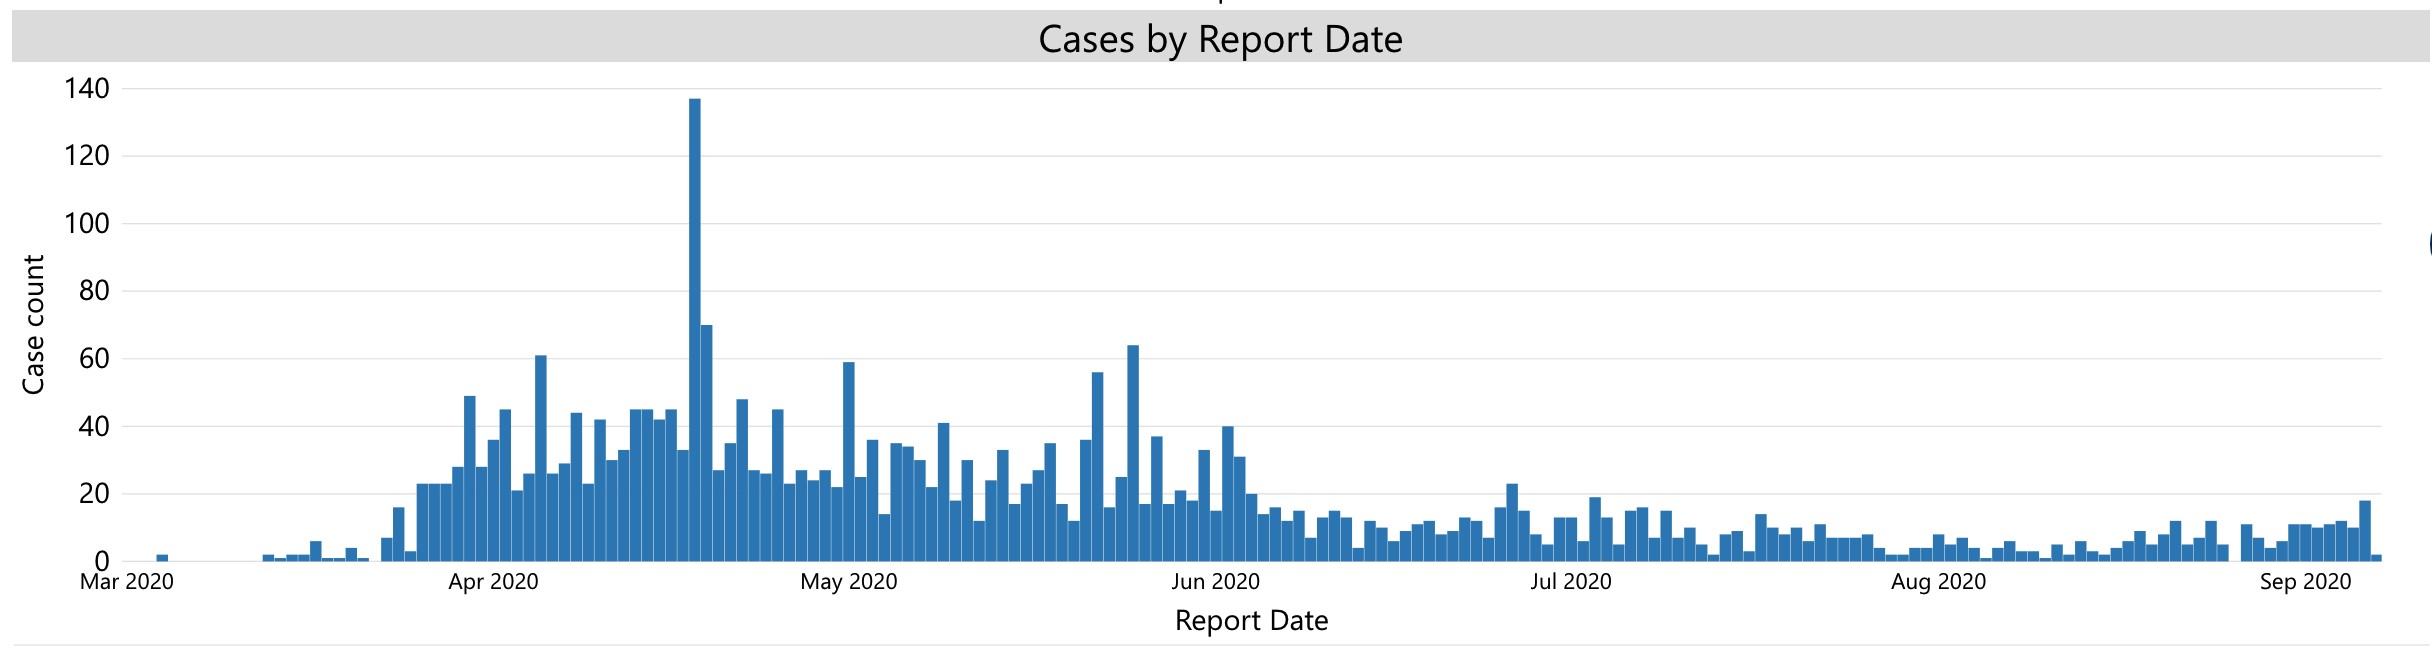
Brampton's COVID-19 case numbers (top chart) continue to far outpace many areas of the province, including neighbouring Mississauga (bottom chart).
Mississauga’s long-term success in controlling the virus and avoiding either large or sustained outbreaks is reflected in the risk profile for schools, especially when compared to the picture in Brampton.
The Pointer identified 10 schools in higher-risk areas, eight were in Malton, an area with unique demographics compared to the rest of Mississauga and sandwiched between hard-hit Rexdale in Toronto and areas of Brampton that have also persistently seen high case counts.
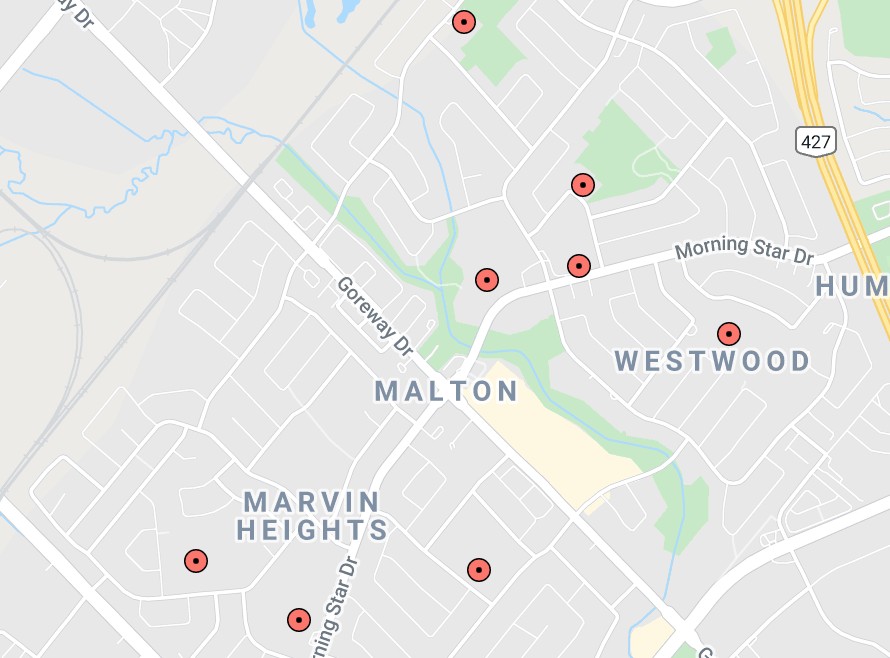
Eight schools in Malton are located in at-risk neighbourhoods.
Malton also shows Mississauga’s infection history falling along relatively predictable lines of density, income and ethno-racial background, three demographic indicators that are often linked.
Of the 15 areas in Mississauga with higher rates of COVID-19, five were removed from The Pointer’s map because institutional cases in long-term care facilities skewed the local picture, while three more did not have schools located within them. Five of the remaining seven include a total of eight schools in these high-risk COVID-19 areas, and are all in Malton in the north-east corner of the city.
Their characteristics are relatively similar. One, around Lincoln M Alexander Secondary School, has a density of 6,192 residents per square kilometre, almost six times higher than Peel’s average density of 1,108.1 (comparable to the GTA average of 1,003.8). Residents in Malton live significantly closer together than most in Peel and the GTA.
This is reflected in the area’s COVID-19 infection rate, with 1,134 cases per 100,000 residents, more than three times the rate in Ontario.
Compared to Mississauga’s wealthy, suburban waterfront communities, the difference is stark. One Census tract area in affluent Lorne Park, with a rate of 132 cases of COVID-19 per 100,000 residents, demonstrates this. It has a density of 1,703 residents per square kilometre, well above the regional average, but only about a quarter of the density in Malton.
The role of density in the spread of COVID-19 in Peel is shown throughout the data. Just five of the 38 Census tracts with rates above 715 cases per 100,000 were in areas below the average density for the region. Nearly 30 percent of the high-COVID-19 Census tracts had average densities of more than 5,000 people per square kilometre, almost five times the density in Peel and the GTA.
It should be noted that Caledon, a huge, mostly rural municipality which is geographically larger than Toronto, dramatically skews the overall density of Peel, but the GTA figure shows that hard hit areas in Brampton and Malton are far more populated per square kilometre compared to the greater metropolitan area of Toronto.
COVID-19 has also been shown to disproportionately impact people with lower incomes, who — throughout the pandemic — have worked on the frontlines in critical jobs required to keep the country moving, well fed and properly cared for.
While white-collar workers had the option of working from home to avoid spreading or contracting the novel coronavirus when a state of emergency was declared in March, many doing lower paid work were not afforded the same luxury. Grocery store employees, those in logistics and factory staff continued to work through the pandemic in relatively close-contact, often using public transportation, significantly increasing their risk of getting the virus.
In Malton, again, this has been the situation for many.
Around Lincoln M. Alexander Secondary School, the average total individual income for the Census tract was $28,860 according to 2016 figures compared to one Lorne Park area that had an average total individual income of $110,898.
To the north, months of uncontrolled cases, low testing and a lack of municipal strategy in Brampton have allowed the spread of the virus to continue at alarming rates. In Brampton, the total number of schools located in Census tract neighbourhoods with COVID-19 infection rates at or above double the provincial per capita rate was 60 as of August 29.
Of the 31 Census tract areas in Brampton (the total after two with primarily institutional cases were removed), eight fit the same characteristics as Malton; they sit well above the average density for Peel, below the median income and above the average number of visible minority residents.
Unlike Mississauga, the virus is also present in communities less commonly associated with the high-risk label. In particular, 61 percent (19 out of 31) of the high-risk Census tracts sit above the median household income in Peel, highlighting how viral transmission has been much more widespread in Brampton. The household income data is skewed when there are a larger number of income earners under each roof, compared with the average in Peel and Ontario.
In Mississauga, areas with comparable household incomes as many high-risk Brampton neighbourhoods, have a fraction of the cases. Again, this might indicate other variables contributing to spread in Brampton, although a higher number of income earners under one roof in certain Brampton areas might be skewing the economic picture in households.
This stark difference between case numbers in the two cities highlights issues of pandemic management plaguing Brampton and adding risk to the city’s return to school.
As The Pointer has previously reported, data from Peel Public Health shows visible minority populations have disproportionately contracted COVID-19 compared to white residents in the region. Between April 13 and July 15, there were 3,880 cases of the novel coronavirus, of those 77 percent were visible minorities despite the region’s population of visible minorities standing at 62 percent.
Schools at risk are in high-risk neighbourhoods that generally fit this pattern.
Just 16 percent of the Census tracts identified as high risk by The Pointer had visible minority populations equal to or below Peel’s average of 62 percent. In some cases, more than 90 percent of residents were not white, and it’s likely that in some parts of Brampton these numbers have grown since the data was collected for the 2016 Census.
One area, sandwiched between The Gore Road and Highway 50 and host to Thorndale Public School, illustrates this. The rate of COVID-19 between February 23 and August 29 sat at 1,269 per 100,000 residents. About 95 percent of the neighbourhood’s residents are visible minorities and it has approximately five times the density compared to the regional average.
The neighbouring tract has a rate of 1,011 cases per 100,000 residents, ten times the rate in the Lorne Park neighbourhood mentioned previously, and hosts three schools: Castlebrooke Secondary School, Beryl Ford Public School and Castle Oaks Public School. In 2016, 92 percent of the neighbourhood’s residents identified as visible minorities.
As the pandemic continues and children return to school, the infection picture may change. On September 2, Dr. Loh said there were 87 active cases of COVID-19 in Peel, with the number of infections on the rise. In a single day since that comment, Peel posted 73 new cases.
Epidemiological data and other demographics can help determine the risk in particular neighbourhoods and areas especially prone to rapid spread of the virus. But outbreaks also occur elsewhere.
With Peel students now back in class, The Pointer will continue to update our interactive map to help parents, students and educators understand the COVID-19 picture around their schools.
Email: [email protected]
Twitter: @isaaccallan
Tel: 647 561-4879
COVID-19 is impacting all Canadians. At a time when vital public information is needed by everyone, The Pointer has taken down our paywall on all stories relating to the pandemic and those of public interest to ensure every resident of Brampton and Mississauga has access to the facts. For those who are able, we encourage you to consider a subscription. This will help us report on important public interest issues the community needs to know about now more than ever. You can register for a 30-day free trial HERE. Thereafter, The Pointer will charge $10 a month and you can cancel any time right on the website. Thank you.
Submit a correction about this story