
UPDATED: After a holiday spike, interactive map shows COVID-19 neighbourhood infection rates and outbreaks at Mississauga and Brampton schools
View COVID-19 Map of Peel Schools in a full screen map
(To use the interactive map, either scroll through the list to find a school, use the search bar in the top right corner of the map to find a particular school, or move through the map to scan different locations. By clicking on the pins representing schools in the two cities, an information card will appear detailing the COVID-19 picture for that particular Census tract, as well as the provincial and regional infection rates for comparison.)
Using 2016 Census tract (neighbourhood) data and COVID-19 case information from Peel Public Health that breaks down infections by geographic area, The Pointer has shown which schools in Brampton and Mississauga are located in low, medium and high-risk neighbourhoods based on data since the pandemic began.
Rising case counts have meant the parameters for each category have changed to reflect low, medium or high-risk in the context of the current viral picture. The most recent definitions were updated on January 28, after a post-holiday spike in cases across Ontario.
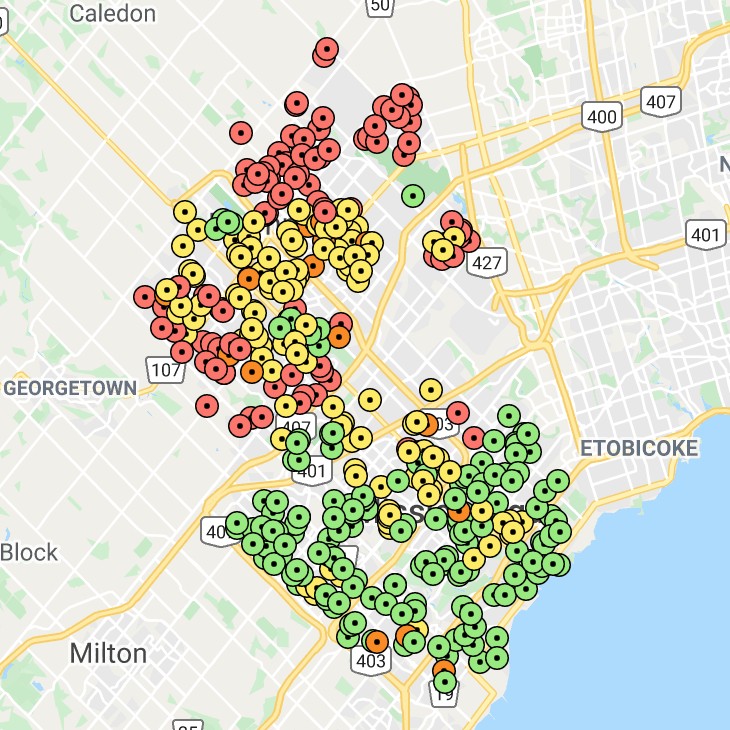
High-risk schools are marked with red dots on the map and are in Census tracts that have a COVID-19 case rate equal to or greater than 5,000 per 100,000 residents between February 23 and January 16. The Ontario rate is 1,595 per 100,000 over the same period, while the Peel Region average was 3,704 per 100,000.
Risk categories have been selected to reflect provincial and local figures. The criteria for high-risk is almost triple the Ontario average and 35 percent above the Peel average.
Readers should also keep in mind that while the Census tract infection rates are used to determine the risk in areas surrounding each school, and each colour-coded pin is placed on the map location of each school, this does not mean infection rates inside the school correspond directly to the neighbourhood rate.
Transmission rates inside public schools across Ontario remain far lower than rates in the general community. Some private schools on the map, and public schools whose students travel from outside the neighbourhood because of special programming such as gifted streams, might have a lower risk of transmission based on community spread because there are limited interactions in the areas surrounding their school.
Individuals do not necessarily acquire the virus where they live, but the risk of community transmission in a particular area increases with every case in the neighbourhood. Some of the schools in the high-risk category included in the map are in Census tracts where the rate of viral infection is as high as 10,000 cases per 100,000 residents or higher.
Those schools marked with yellow and green dots are located in medium and low-risk areas, respectively. Medium areas are between 2,000 and 4,999 cases per 100,000 to capture the Peel region average. Low risk is defined as 1,999 cases per 100,000 or fewer. As the map indicates, the majority of lower risk neighbourhoods are located in Mississauga, especially in its southern area.
After months of tracking cases at PDSB and DPCDSB, The Pointer is no longer updating individual cases. The prevalence of school cases in the region makes the task logistically difficult and does not tell parents or residents the full story.
Instead, the map now shows an orange dot to represent a school outbreak. This will be updated daily around 12 p.m. when Peel Public Health refreshes its list and resolved outbreaks will be removed from the map.
An outbreak is significant because it represents a situation where local health officials believe cases may have spread within the school. This triggers an investigation to establish the risk associated with the outbreak.
Any school closures will be indicated with a blue dot. So far, these have been very rare.
Submit a correction about this story