
Inflated transitway figures mask the failing of a key piece of Mississauga’s infrastructure
On November 19, the City of Mississauga heralded “five years of growth” on its transitway, a bus rapid transit corridor running alongside Highway 403.
“Since the first four stations opened, MiWay’s annual ridership numbers have steadily increased along with new investments in service through the MiWay Five Transit Service Plan (2016-2020),” a news release proudly stated. “In its operation, the transitway has seen an annual ridership of 5.1 million in 2019, providing service across 12 stations.”
Yet, for many who travel past the transitway and see its stations regularly deserted, it didn’t add up. Though a testament to the city’s commitment to public transit, the flagship piece of infrastructure has divided opinion since it opened.
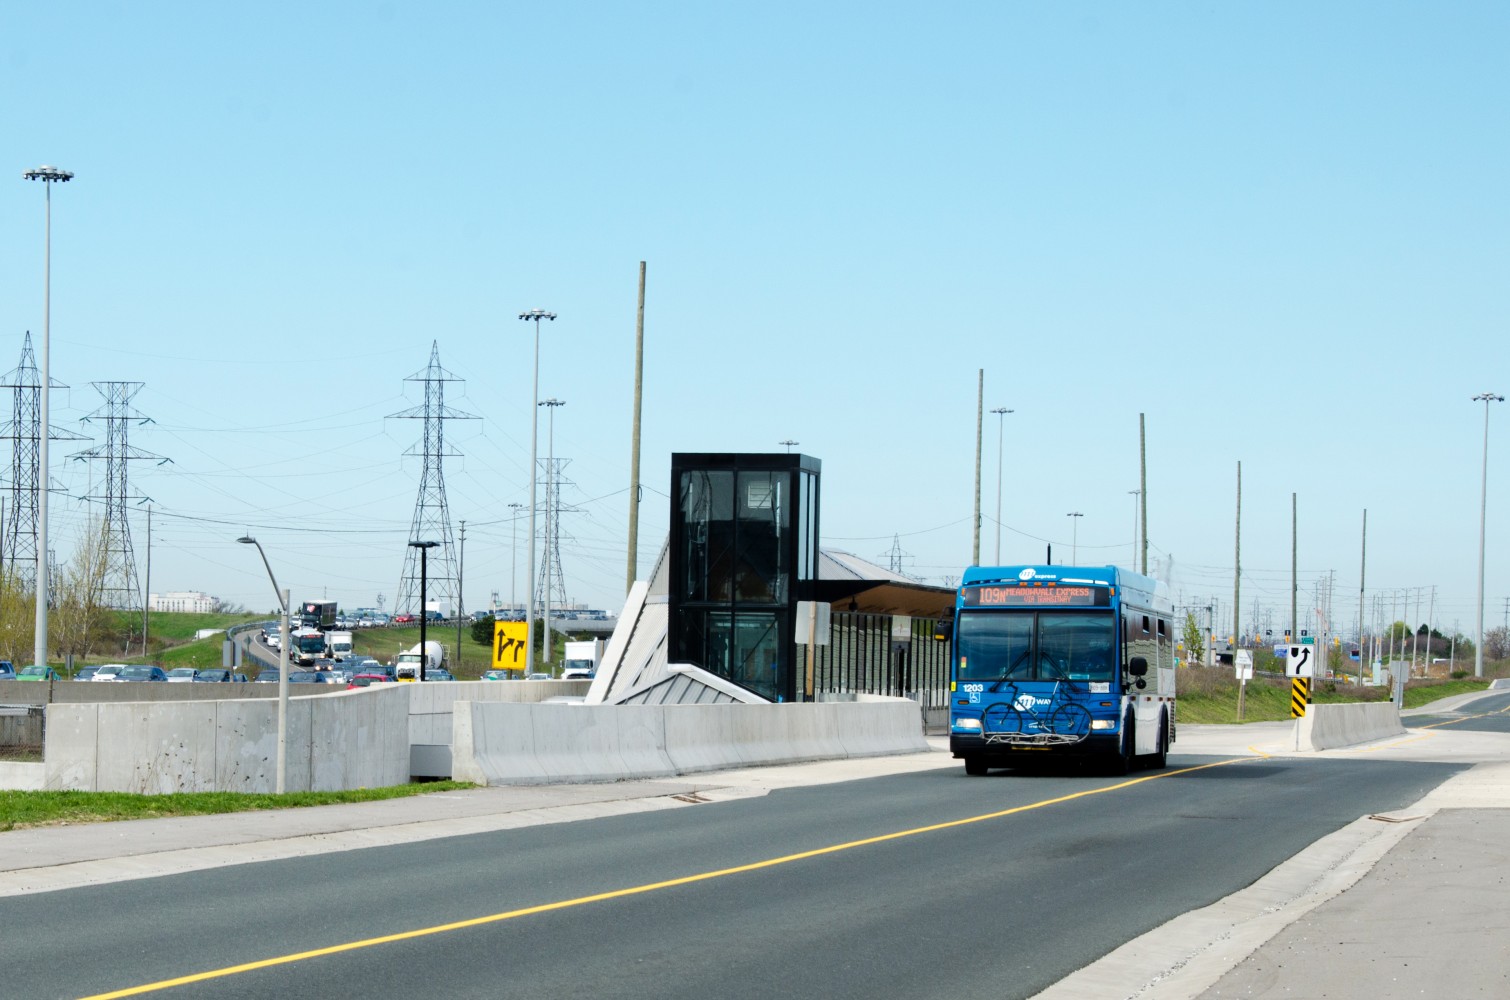
The Mississauga Transitway is built adjacent to Highway 403.
Generally, those who use public transit and support its creation believe that MiWay is underusing the road, with Sunday service initially not even offered along the route. Those who don’t support it question why the city built a corridor next to a highway, with little density or opportunity for growth.
Now, analysis by The Pointer of individual stop data, suggests the city has been consistently and significantly inflating its ridership numbers along the route to mask the reality that the $500 million piece of infrastructure is not providing value for taxpayers.
It took a bit of digging to reach the real ridership numbers. When the 5.1 million ridership figure referenced in the city’s press release was initially queried, the city provided an odd response.
City staff told The Pointer that they calculated ridership along the transitway by combining boardings and alightings to create a number they refer to as “Total Transitway Figure”. This number, quite simply, counts people getting both on and off the bus at any point along the BRT route.
“The ridership on routes 100, 107 and 109 is 5.1M boardings annually of which 5.0M boardings and alightings occur are on the Transitway (Total Transitway activity),” a spokesperson said. “If we include routes 87 and 110 as well the route ridership increases to 6.7M annually with 6.1M on the Transitway. We did not include routes 87 and 110 when reporting the 2019 figure of 5.1M in order to be consistent with reporting in previous years.”
The 5.1 million boardings number is the one quoted in city documents and press releases. It refers to the total ridership (boardings alone) of routes 100, 107 and 109 which run for some of their service along the city’s transitway. However, the city attributes this cumulative number “ridership” for the transitway alone, which is somewhat misleading given that these buses stop at busy places not on the transitway including Malton, the airport, Meadowvale Towncentre and Islington TTC subway. In justifying this decision, the city again provided The Pointer with its Transitway Activity figure.
At first glance, the fact that 5 million of the route’s 5.1 million ridership figure take place along the transitway is fantastic. Yet, looking closer, that figure – Transitway Activity – is blatantly inflated. Between different cities in Canada there can be discrepancies with those who measure “trips” (which do not double count transfers) and “boardings” as the standard for ridership. Boarding measurements refer to the number of people who get onto a bus in a period of time, it does not count when people get off. Measuring those who leave the bus and counting them again is, quite simply, double-counting passengers.
The Pointer consulted various transit websites, including Edmonton Transit Services and Translink Vancouver – both explained that they use boardings for its ridership counts. Neither service publishes and tracks alightings from their services for these figures. A spokesperson for the TTC also confirmed their statistics were based on the number of boardings alone. Even MiWay’s own 2019 budget documents refer to “Annual Passenger Boardings” in its statistics.
The industry standard is that ridership means boardings and few services seem to calculate “activity” on their routes in the manner the city has for the transitway.
“We speak in terms of rides rather than people,” MiWay explained to The Pointer when asked for clarification. “So we count boardings and alightings. You go somewhere and then you go back usually with some time in between. As our riders are anonymous many will take two rides (there and back) but some take one way trips and some multiple trips. What we are certain of is someone got on or off.”
Measuring boardings and alightings is extremely expensive, something which Geoff Marinoff, the director of MiWay, previously explained to The Pointer. Measuring boardings is relatively straightforward and can be done by accessing things like Presto data, while measuring alightings requires either a manual counter or the installation of counting technology at the backdoor of buses. That is to say, it is not a measure applied to most routes in the city simply due to cost.
Though MiWay uses boardings and alightings to measure their Transitway numbers, their counts for other routes appear to be done by boardings - the standard measure, it remains unclear why the city uses a different measure when assessing the transitway. A document the city previously provided to The Pointer with ridership for all routes was even titled “MiWay Boarding Counts”, with data for routes across the city all recorded in terms of boardings alone.
MiWay provided The Pointer with their September 2019 data for the Transitway as well as the formula they use to calculate annual statistics to take into account changes in ridership through holiday schedules. Putting these figures into the city’s own formula, it is possible to produce the actual annual figure for transitway boardings. Looking at these calculations compared to the numbers the city quotes lays the usefulness of this infrastructure bare. The combined boardings of the 100, 107 and 109 routes is 2.5 million rather than 5 million (Transitway Activity) or 5.1 million (city figure in budget), while the boardings when including routes 110 and 87 is 2.9 million instead of 6.1 million (Transitway Activity) or 6.7 million (city figure in budget).
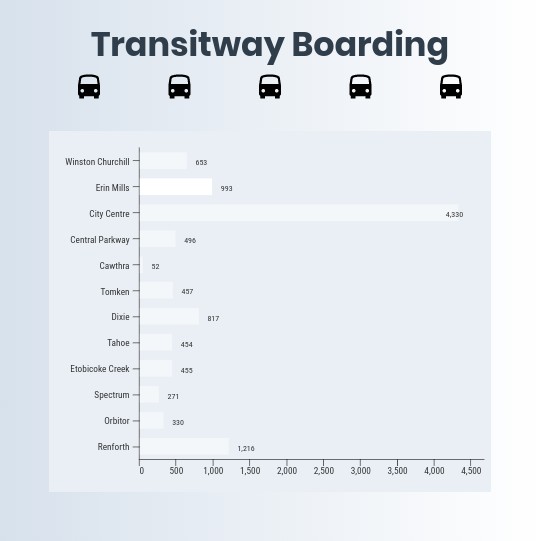
A per-stop breakdown of transitway data when looking at boardings alone, instead of the city's measurement of boardings and alightings.
Based on the figures provided to The Pointer from September 2019, there were more alightings on the transitway than boardings. Including all routes, 2.9 million people got onto the bus, while 3.2 million got off, a statistic which suggests that the traditional boardings only number may not do the route justice. However, a more appropriate and accurate picture may be to find the average (3.05 million) of the two, not just to add them together.
However, applying the standard measurement of boarding to the transitway shows that the city’s official figures for the transitway are inflated by 2.5 million to 3.2 million riders, depending upon whether or not routes 110 and 87 are included. Even if this more generous average were to be accepted, the city’s figures are still millions of riders above the true number.
In short, the city has inflated its ridership figures in two different ways. In its budget documents and press releases, it refers to the total number of boardings for all buses which use the transitway, despite the fact that only around half of boardings actually take place on the route. Secondly, when The Pointer asked for transitway specific data, the city offered its “Transitway Activity” number which inflates ridership by counting boardings and alightings together and is not a measurement typically used by other transit authorities. When questioned about these misleading and inflated figures for the transitway, the city stated they count “people” who get on and off the bus, rather than riders.
This would suggest that the figures which the city offers for its transitway ridership in the budget, press communications and on its website are misleading.
Looking at how many people get on at each stop makes for even more dire reading. The disparity between the most used stop (City Centre) with 4,330 boardings and the least used (Cawthra) with just 52 boardings is staggering. Only two stops, Renforth (1,216) and City Centre boast more than 1,000 daily boardings, while seven of the route’s twelve stops have fewer than 500.
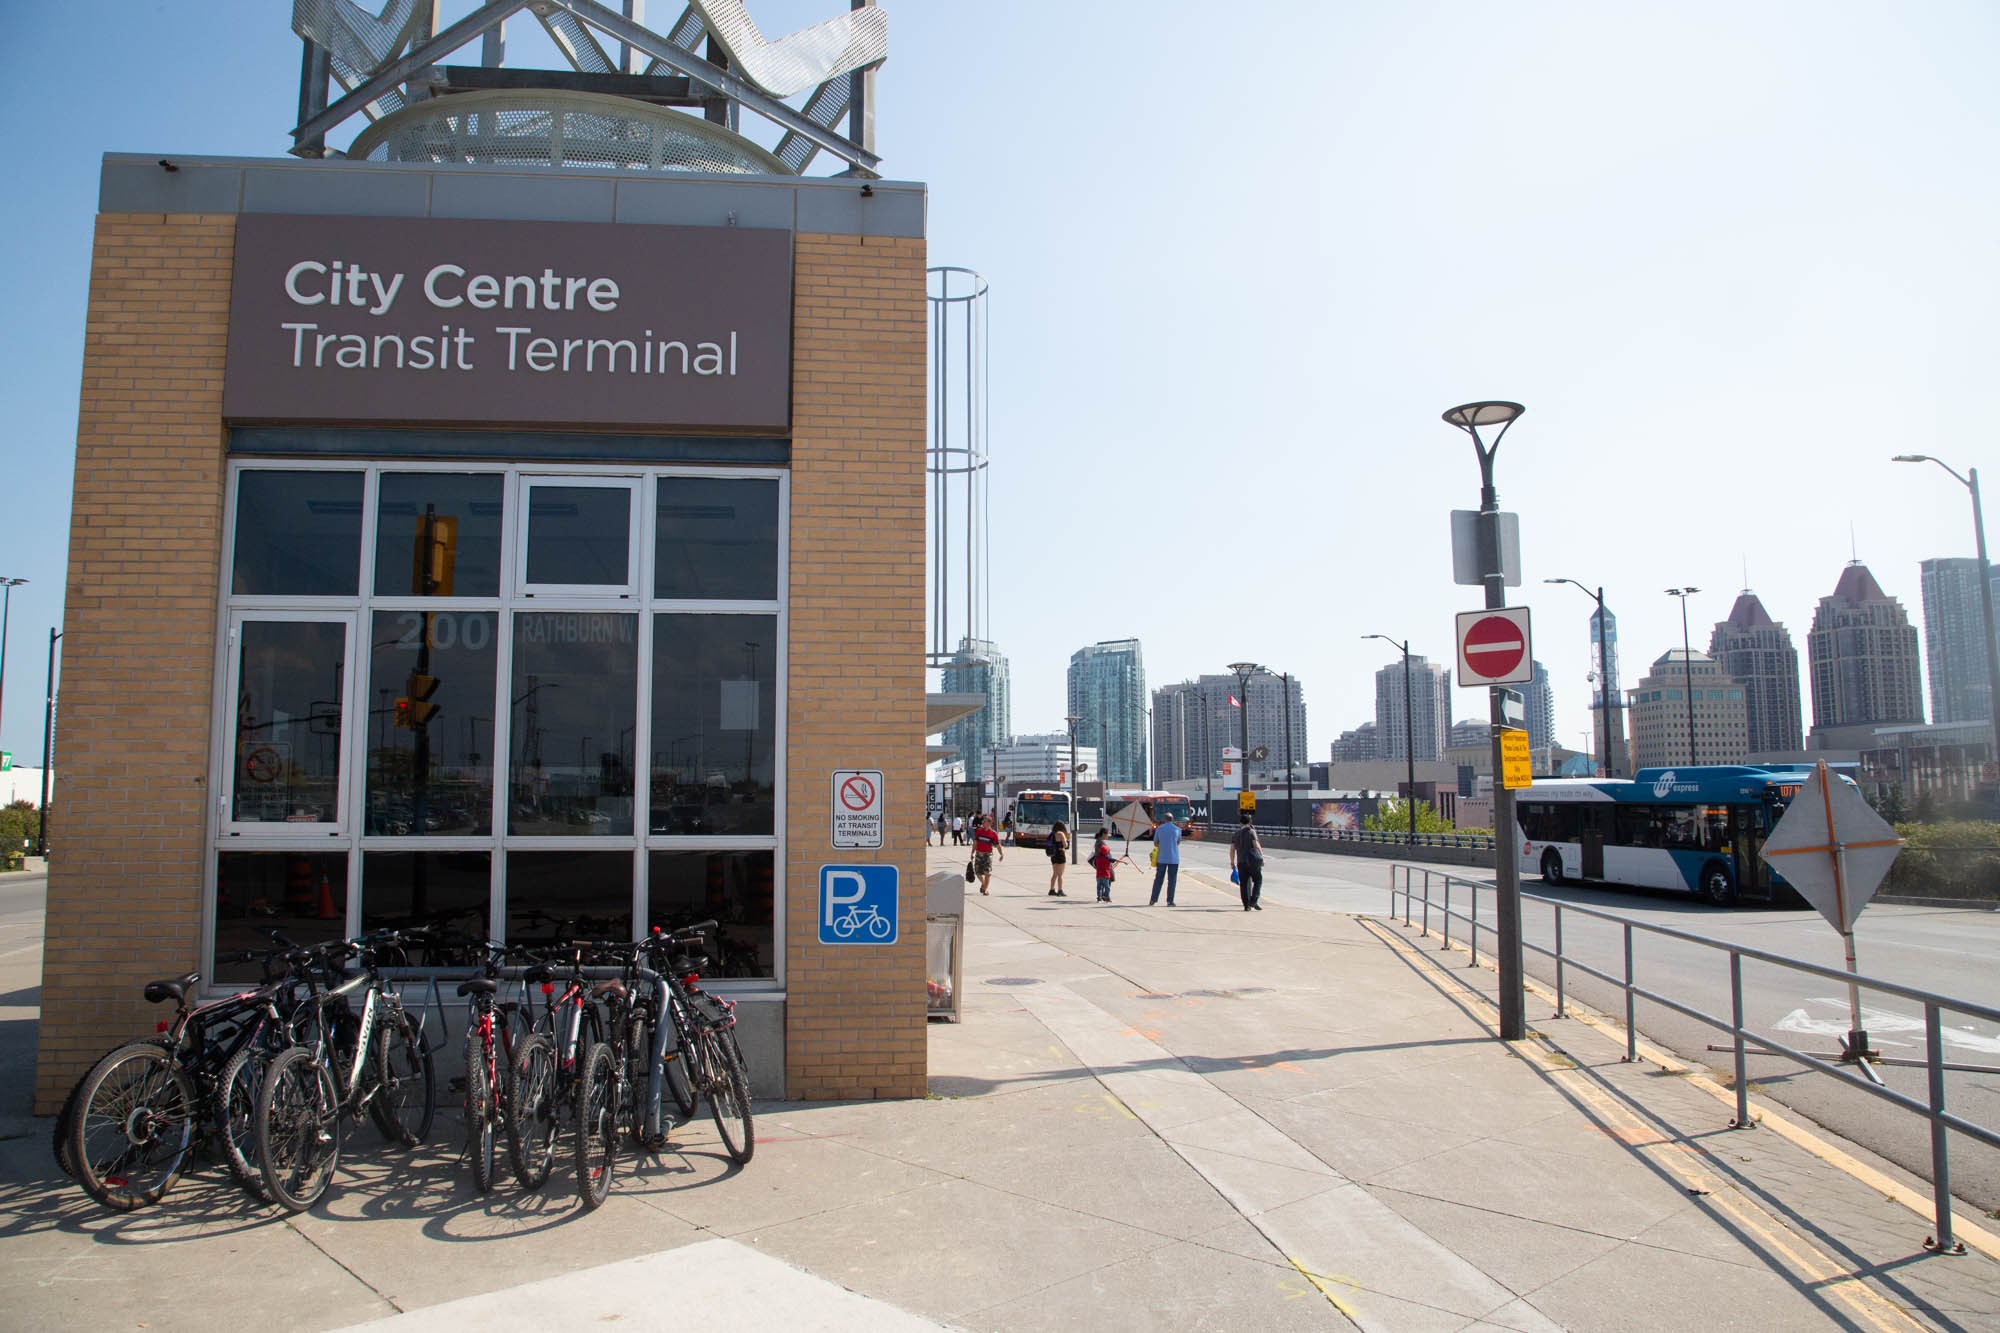
The City Centre stop is by far the most used along the transitway.
The difference between boardings and alightings, while not the best measure of a route’s ridership, can help to illustrate the utility of a stop. Those where there is a bigger discrepancy between on/off numbers are generally more useful because this implies the routes are bleeding riders to other services and therefore connections. If a similar number of people board and alight, those stops essentially serve the same few hundred commuters, where larger differences in boardings and alightings show people passing through on a series of different journeys.
For example, both Cawthra and Central Parkway in the centre of the transitway have a difference of just two and three between boardings and alightings. A further six stops on the route have a difference of fewer than 35, with one of them – Spectrum – showing a difference of just five. That would suggest that these eight stations serve the same commuters everyday, with the city’s Transitway Activity figure counting them once on their way out and once on the way back. Such a small difference in the number of boardings and alightings suggests that these commuter stops are used by the few hundred people who live around them, and not the heartbeat of the Mississauga transit system.
Perhaps unsurprisingly, the City Centre stop, which links with a particularly large GO network and Square One shopping centre, has 938 more alightings than boardings, showing people moving off to connecting services. Winston Churchill, Tomken and Renforth (TTC) stations also boast a difference of between 40 and 80, significantly lower than the City Centre statistics, but a little less grim than some other stations.
As a stop connected to a large, thriving transit network and an attraction in Square One, the City Centre stop is the epitome of what the transitway and key transit routes should do. On the other hand, Cawthra sits quite literally between a highway and a field, inaccessible except by car. Where City Centre boasts a host of connections and Mississauga’s main transit hub, the city’s transitway website lists no connections at all for Cawthra.
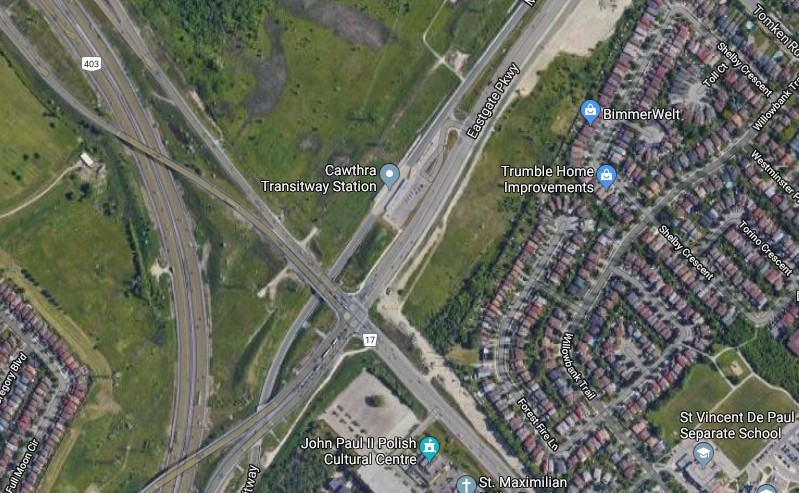
The low ridership from the Cawthra station could be due to its isolated location and lack of connections to other transit services.
It is unclear exactly how much disused stations like Cawthra, which has heated platforms, costs the city. According to the city, their costs are funded through the winter maintenance and bus rapid transit reserves, making their annual burden difficult to calculate. The Pointer approached the city for the total maintenance costs of transitway stations. However, the city did not comply, providing references made to the rapid bus transit and winter maintenance funds.
To simply call the project a failure is far too simplistic. The transitway is serving a purpose for some, even if it is not living up to its price tag of more than half a billion dollars. As the city is keen to highlight, stops at Renforth, close to airport offices, and the City Centre, near Square One and downtown, connect two high employment areas, an explanation for why they have ridership in the thousands compared to Cawthra’s disappointing 52 or Spectrum’s 271 daily riders.
It is the rapid transit corridor element of the route which is not being utilized by the city to its fullest. Though many of the transitway’s stops are in low growth and low density areas, the speed offered to buses on the route and potential lack of delays means that, with the right connecting services, the route could be pivotal. Despite the fact that not everyone in Toronto lives near the TTC subway, it acts as a high speed trunk route, connecting people across the city with the help of a transfer from their local bus route. Hypothetically, the transitway could do the same.
Jonathon English is completing a PhD with the University of Toronto and Columbia University which compares Toronto transit services with San Francisco and Washington DC, in particular, he focuses on the power of frequency in suburban bus networks. He explained to The Pointer that the planning behind the transitway was flawed from the start and how the city might begin to win back some of its investment.
“Metrolinx basically took a whole pile of plans which the cities and regions had, in some cases for years and years, and just sort of revived them,” he explained. “The Mississauga Transitway has been around since the ‘80s and they built it because it was a plan which had been sitting on a shelf since the ‘80s, much more than because it served some particular desperate transit need.”

Jonathon English is completing a PhD with the University of Toronto and Columbia University.
Discussing the issue of the transitway’s location, though, English was less critical. “Where I would push back is to say [that] to be successful, rapid transit does not necessarily need to have its stations all in highly developed areas,” he continued. “The Toronto subway is highly busy even though many of its suburban stations have nothing around. The reason is that the subway is embedded in a frequent service network, so even though there’s not much around York Mills station there’s a bus that comes in every two minutes, bringing a bus load of people into those stations. The immediate walking distance catchment of the transitway or the subway or whatever is not as important as connected service.”
This stands to reason with one simple problem: people like things to be easy. That is to say, if a service runs as regularly as the subway, people will transfer without a second thought if it only involves a few minutes of waiting around. However, if both connecting services come every 30 minutes or even every 15 and mistiming a connection can add half an hour to an hour onto any journey, the idea becomes instantly unappealing to anyone who could drive instead.
“This is the problem in Mississauga,” English continued. “The connecting service does not run nearly frequently enough to make connecting viable.”
The perfect example of this exists just north of Mississauga. As The Pointer has previously reported, Brampton Transit has received peanuts in terms of federal and provincial funding for its infrastructure, with contributions to a handful of electric buses and support to expand a storage facility. Yet, transit bosses in Brampton decided to run their service as frequently as they could possibly afford across a grid network in the city without shiny BRT lanes or anything else. As a result, even without the investment other cities have received, Brampton saw transit ridership increase at an unprecedented rate. MiWay, despite increasing their transit hours year-over-year, appear to have looked towards big-ticket infrastructure investment to improve ridership, not regularity and reliability.
According to English there are two ways infrastructure like the transitway is traditionally useful, neither of which Mississauga is currently operating. In some cases, the transitway can act as a shortcut for a few kilometres for a bus, something for the service to nip on and off of. That is to say rather than running routes through the city and then along the length of the transitway before they turn back (as Mississauga does now), many different routes could be changed to use a couple of stations on the transitway, reducing the time they spend in traffic and bypass difficult sections of road, without going all the way from Winston Churchill to Renforth. Equally, a transitway shuttle could run along the BRT corridor every couple of minutes, similar to an LRT, with connections at every stop. This option is not uncommon, but would require a major increase in service from MiWay with the shuttle bus required to come every five minutes to serve a viable purpose and connections at every station to come every 10 or 15 minutes at most. Though both these options are possible without changing the infrastructure of the transitway, they would require a fairly significant investment from the city itself.
For those who read the proposed 2020 budget document in detail, one line on this topic jumped out: the MiWay portion promised “improved transitway integration.” The city broke these plans down after a request from The Pointer. It includes plans to improve the information displays at stations, improve service agreements with non-MiWay companies using the transitway, improve access to TransHelp, and to work with the TTC to create fare integration between the two services.
While these may be positive changes, they’re administrative tweaks and don’t help to solve the fairly monumental problems facing the transitway.
With significant resources already sunk into the project, the city can’t abandon the transitway and must work to improve it. Both the 2019 and 2020 budgets include money to complete a TPAP (planning work and environmental assessment) for the expansion of the City Centre station to improve its integration and connectivity, a move all data would suggest is wise.
With MiWay’s next five year plan still in development, the future of the transitway is yet to be decided. If the designers of the transit service’s next guiding document look at the infrastructure with inspired vision, they could still turn it into a key rapid transit corridor at the heart of a regular bus network. If they can commit to that, they could see ridership increase dramatically, similar to the spike enjoyed by Brampton Transit.
Email: [email protected]
Twitter: @isaaccallan
Tel: 647-561-4879
Submit a correction about this story